
Burden drivers
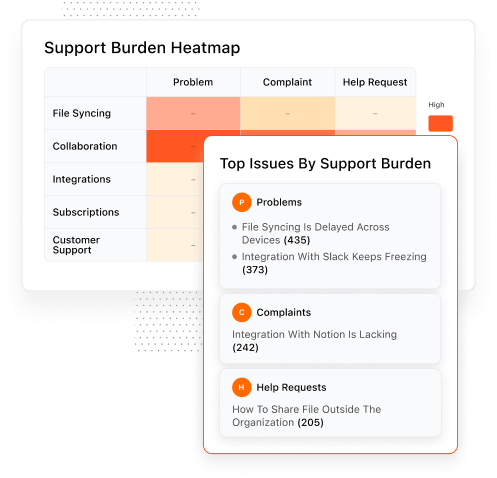
Pinpoint what’s driving ticket volume and cost-to-serve, including hotspots and the issues that keep coming back.
Klarion quantifies what’s driving cost, SLA risk, and CSAT decline, so you can prioritize systemic issues and plan capacity.
Get a Demo
Klarion delivers the story behind the metrics, with quantified drivers and priorities you can act on.
Pinpoint what’s driving ticket volume and cost-to-serve, including hotspots and the issues that keep coming back.
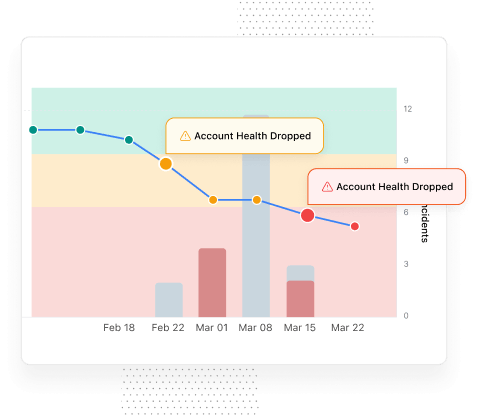
Spot SLA exposure, churn signals, and the accounts most likely to escalate before the issue turns operational.
Surface the conversation patterns behind customer frustration so teams can address pain before CSAT starts to slip.
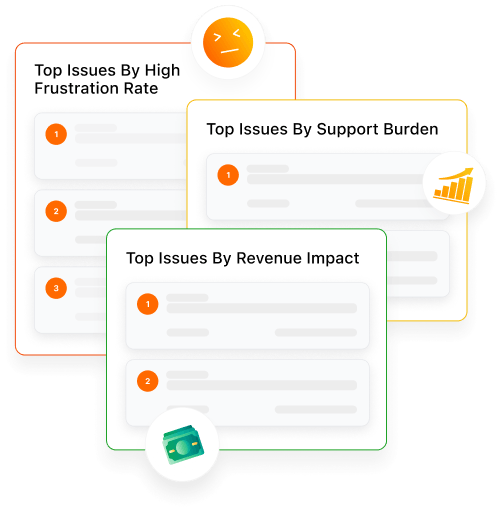
Translate repeated support pain into prioritized fixes your support, product, and operations teams can align around.
Build a Support operation that gets ahead of pain and fire drills.
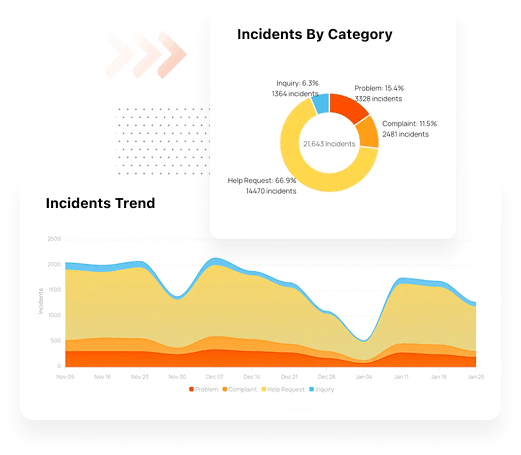
Why it matters: Capacity decisions need a credible root-cause view.
Klarion delivers: Quantified volume and cost hotspots, plus the issues driving repeat contacts.
Why it matters: Without a shared view, prioritization stalls and teams drift.
Klarion delivers: A shared view of recurring issues and customer impact, grounded in full conversation context.
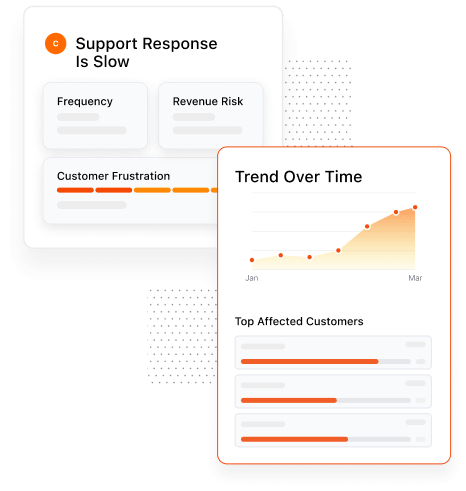
Why it matters: CSAT can lag before you see it in reporting.
Klarion delivers: Frustration drivers, trend shifts, and rising issue patterns before they hit survey metrics.
Why it matters: Strategic accounts can heat up without warning.
Klarion delivers: Account-level risk signals and clear summaries of what is driving pain.
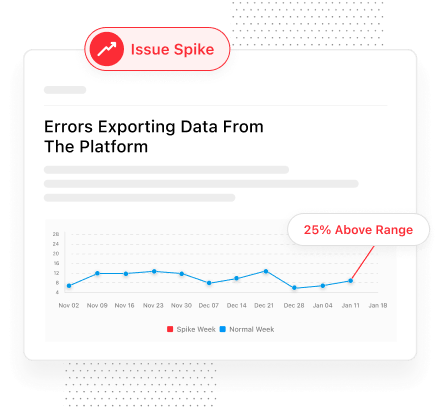
Why it matters: Post-release surges can snowball fast.
Klarion delivers: Fast detection of what is trending, severity, and impacted customers.
Most support analytics treat each ticket as one data point and every ticket as equally meaningful. That breaks down fast.
Tickets often contain multiple issues, product feedback, and experience feedback. Others are just noise. Klarion fixes the inputs first by separating distinct issues, filtering out non-signal tickets, and standardizing the data over time. The result is trends and findings that Support, Product, and leadership can trust.
Ticket-level reporting flattens each conversation into one label, which hides the real drivers behind volume, pain, and escalations. Klarion breaks long threads into distinct issues so support leaders can see what is actually creating workload and customer frustration.<
Native reporting is useful for operational views, but it usually relies on surface-level tags and single-ticket summaries. Klarion adds conversation-level extraction, issue normalization, and cleaner historical analysis so reporting stays trustworthy as complexity grows.
Klarion reads the full conversation and separates out each distinct issue, request, or complaint instead of forcing the thread into a single bucket. That means long conversations and blended tickets still contribute accurate signal to your reporting.
Klarion identifies tickets that are administrative, transactional, or otherwise not meaningful feedback signal. Removing that noise gives you cleaner trend lines and prevents false spikes from distorting support and product priorities.
Klarion reprocesses historical conversations using the same extraction logic and issue taxonomy, giving you a consistent baseline across time periods. That makes trends more comparable and much more dependable for planning and executive reporting.
Klarion watches for meaningful increases in issue frequency, frustration intensity, and account-level risk across incoming support activity. Alerts are triggered when those shifts cross thresholds that suggest escalating customer pain or growing operational risk.
Klarion scores frustration from the language and context inside conversations, then rolls that up into usable support metrics. High Frustration rates help teams separate routine volume from the issues most likely to damage CSAT, renewals, or escalation load.
Yes. Klarion lets you slice the signal by account, cohort, plan, region, product area, and other business-relevant groupings so you can understand who is affected and where the biggest support or revenue risk is building.
Implementation typically starts with ingesting your support data, validating the issue structure, and aligning outputs to your reporting needs. Teams usually see useful signal quickly because Klarion is designed to surface clear drivers and trends early in deployment.
Yes. Klarion is built to improve the quality of messy support inputs by extracting issues directly from conversation content and normalizing the signal. That means imperfect tags or inconsistent historical hygiene do not block you from getting value.
CSAT is a sampled, after-the-fact satisfaction signal, while Klarion measures pain directly from support conversations as they happen. That gives teams a broader, more immediate view of where customer frustration is building, even when survey coverage is limited.